
 diglloydTools™

$220 SAVE $130 = 37.0% Western Digital 16.0TB Western Digital Ultrastar DC HC550 3.5-in… in Storage: Hard Drives
|
|

|
|

|

|

|

|

|

|
Analyzing System Performance in OS X Mavericks
The graphical displays provided by Activity Monitor are excellent (found in the Applications/Utilities folder).
is found in the folder under . Drag it into the dock so that it’s always readily available. Especially on dual display systems, it can be left open on the 2nd monitor for conveniently monitoring system performance.
For more on CPU cores and how well programs use them, see CPU Cores and Application support for multiple CPU cores.
Percentage CPU usage
Sometimes you want to know which program is using the most CPU time. The main window shows processes and various information about them.
Choose in the popup menu at center. Sort by column header y clicking on the column title. Generally it is most useful for the arrow to point down so that the largest values sort to the top.
Right-click on column headers to choose which columns to display, which can also be arranged to suit.
As shown below, the and columns have been added to the Disk tab, because it is generally useful when watching disk activity to also watch CPU activity.
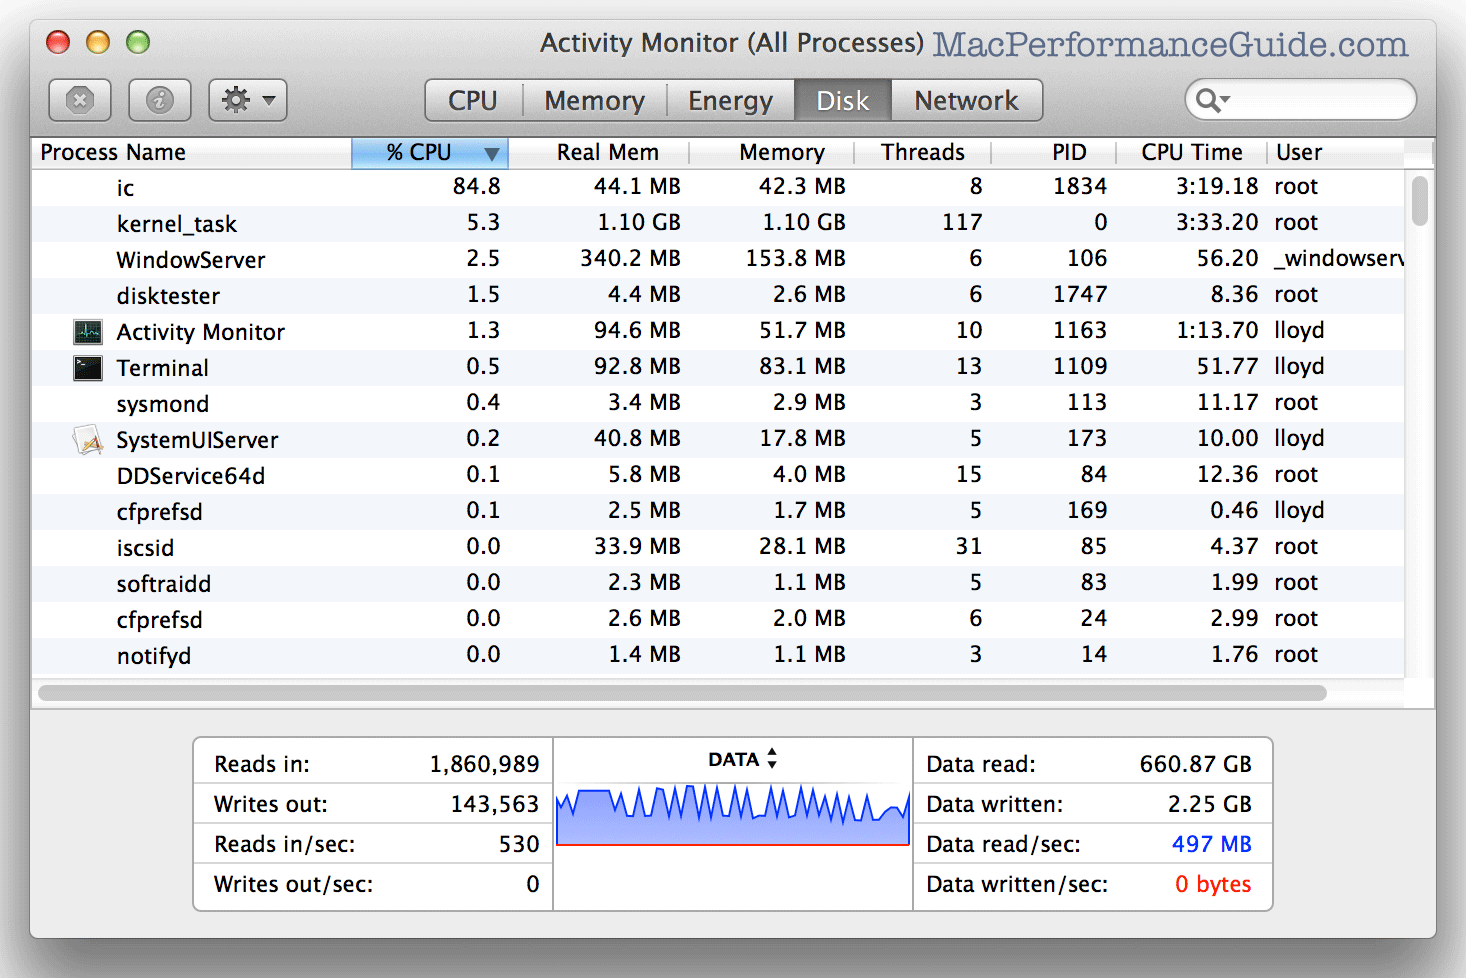
The example above shows the 'ic' (IntegrityChecker) program taking 84.8% of one CPU core. Other system activity is negligible in CPU usage terms, but there is substantial disk I/O occurring (497 MB/sec reads).
Some “vampire” programs waste CPU time when doing nothing useful— these are programs you don’t want to leave running when you’re not using them!
CPU history graph
The history graph () can be sized wider to show CPU history over quite some time (). Black areas indicate idle CPU cores. Green represents CPU utilization by user applications, red represents CPU utilization by Mac OS X itself, and blue indicates low-priority tasks. The example below shows a system which ran repeated MemoryTester 'compute' tests.
The display updates as specified, scrolling left at each interval. Observe this display for your favorite programs, and you can see how well (or poorly) they utilize the CPU cores during your particular workflow
Because of virtual CPU cores, a 4-core CPU will show 8 rows, one for each virtual CPU core. Virtual CPU cores are generally weaak sauce, so full utilize of a 4-core CPU can be fairly said to be 400% or better.
Seagate 22TB IronWolf Pro 7200 rpm SATA III 3.5" Internal NAS HDD (CMR)
SAVE $100
