
 diglloydTools™


|

|

|

|

|
$220 SAVE $130 = 37.0% Western Digital 16.0TB Western Digital Ultrastar DC HC550 3.5-in… in Storage: Hard Drives
|
|

|
|

|
Intel X25-M SSD on MacBook Pro
Related: 4K and 5K display, 6K display, Apple macOS, caching, computer display, diglloydTools, DiskTester, hard drive, laptop, MacBook, MacBook Pro, memory, Other World Computing, Photoshop, RAID, Seagate, SSD, storage
Updated Feb 14, 2009
This test compares the 80GB Intel X25-M solid state drive to four late-2008 state-of-the-art 2.5" laptop hard drives. Even if you’re not in the market for SSD, the hard drive comparison will be very interesting for those looking for an upgrade.
The Intel X25-M is highly regarded, but does it actually improve the computing experience consistently? The answer is yes, but there are some caveats as to whether the X25-M will actually make a difference for the tasks you actually perform. And there are some downsides, such as capacity.
Update Feb 14, 2009: Intel is now shipping a 160GB version of the X25-M, with claimed performance identical to the 80GB model. That simple change may make all the difference (capacity) for notebook users. See also how the X25-M performs in a Mac Pro and with RAID. View prices on SSD.
Apple’s offerings
In January 2009, Apple introduced the 17" unibody MacBook Pro with an optional 256GB solid state drive (will display as 244 gigabytes when formatted). In typical Apple fashion, you must buy the 17" model to get it; the 15" model offers only the 128GB option. There is no technical reason for this, just a user-unfriendly sales decision.
The 256GB Apple offering might be very appealing for some users on the capacity issue alone offering more than adequate storage for most uses. But it remains to be seen if the performance can match the X25-M.
Not all solid state drives are equal
This test is of the 80GB Intel X25-M. Most other solid state drives on the market offer inferior performance, and many have “stutter” problems. At the other extreme, there are Intel’s X25-E server-grade models, offering 2.4X the write-speed performance (according to Intel specifications). Those “extreme” models use a different technology, cost an arm and a leg, and top out at 64GB.
Apple isn’t saying which brand/model 128GB solid state drive is being offered in the MacBook Pro unibody. But at a lower price and higher capacity than the X25-M, and assuming the usual Apple pricing, there is a very good chance that it will not perform as well as the Intel X25-M reviewed here.
Do not buy the Apple 128GB SSD option assuming it will perform as well as the Intel X25-M. It might, and it might not.
SSD slowing down? Get it back into shape with DiskTester 'recondition' .
Consistent performance — no stutter
The graph below shows MB/sec while filling (writing) the entire 74.4GB volume with 1000 equal-sized files (about 740MB each). Except for the last few gigabytes where the drive is almost completely full, the times are very consistent, suggesting that a striped RAID might work very well (if you can get over the price and capacity issues).
Solid state drive trends
Solid state drives are the future of performance. Composed not of spinning magnetic platters, but of memory chips, they will offer better and better performance at higher and higher capacities every year, following Moore’s law like other types of chips.
Solid state disks are now being used in enterprise-grade servers as well as higher end notebook computers. Performance ranges from mediocre and problematic to outstanding; be sure to look past the hype at actual performance of any SSD device you are considering—it’s definitely a caveat emptor world out there, and there are problems with many offerings.
In 2009, we are likely to enjoy substantial advances in performance and capacity along with reductions in cost. Quality will still cost money though, don’t think for a minute that bargain-bin is a good place to get a SSD.
Drives tested PERMALINK
Four hard drives were used as comparisons for the Intel X25-M. They are all around $100—great choices for for higher performance and/or more space, whether you have a MacBook Pro, MacBook, iMac, or MacMini. For your convenience, the View links below take you to OWC for specifications.
Intel X25-M 80GB Solid State Drive View
This is the unit everyone is excited about. At only 80GB (74.4GB formatted), it’s small in comparison to current hard drives.
320GB Hitachi Travelstar 7K320 (7200rpm, 16MB cache) View
Mainstream capacity, and is the drive that Apple ships for its 320GB option in the late 2008 MacBook Pro (though Apple has been known to use multiple suppliers).
320GB Western Digital Scorpio Black (7200 rpm, 16MB cache) View
An alternative to the Hitachi Travelstar 7K320.
320GB Seagate Momentus 7200.3 (7200 rpm, 16MB cache) View
An alternative to the Hitachi Travelstar 7K320. 500GB Western Digital Scorpio Blue (5400 rpm, 8MB cache) View
This ultra high-capacity notebook drive runs at 5400 rpm, but with 56% more capacity than a 320GB drive, its higher data density might offer comparable performance to 7200 rpm drives; 7200 rpm is 33% faster than 5400 rpm. Partition this drive to have the same formatted space as a 320GB drive, and it might be attractive.
Advantages and disadvantages of SSD PERMALINK
This content has been moved here.
Terminology PERMALINK
A gigabyte as used in all reviews on this site is defined as 1024 X 1024 X 1024 or 1,073,741,824 bytes. Mac OS X defines it this way and so does DiskTester. Drive manufacturers use 1000 X 1000 X 1000, hence the size disparity.
Speeds in megabytes per second follows the same convention eg a megabyte is 1024 X 1024.
Comparing SSD to hard drives objectively
This content has been moved here.
System boot and application launch speed PERMALINK
If you haven’t already, read Boot Drive Dogma for details on why system boot time and application launch times are smoke without fire, issues that dilettantes waste time worrying about, but the rest of us use that time to get useful work done. Of course, if you’re on a single drive system, some of your applications can benefit immensely from a fast drive, but it’s not because of system boot time and/or application launch times.
Speed your system up in general by taking full advantage of Mac OS X caching: get the OWC 6GB upgrade kit for your MacBook Pro, or plenty of memory for whatever Mac you use.
System boot speed PERMALINK
System boot speed is an irrelevant metric, but everyone wants to know it, so we oblige. And if you’re rebooting more than once a week (travel excluded perhaps), something is wrong with your system or your approach; use the “sleep” facility, especially on a laptop.
System boot time is hard to quantify: does it include total time from initiating a reboot, or just the time once the Mac makes its musical “chong”? For example, it takes about 30 seconds or more for the 2.8GHz MacBook Pro to perform system housekeeping before it actually reboots with the musical “chong”.
Ignoring the reality of the foregoing, which makes the system boot time metric even more questionable, below are times measured from the musical “chong” to when the Finder has fully drawn its windows and (also) when Activity Monitor (set as a startup application) shows its CPU history window.
Carbon Copy Cloner was used to duplicate a small 24GB system from an external Firewire 800 drive onto a 74.4GB system volume (with installed apps like Photoshop and a few others, plus test files). So all drives got a fair chance at a clean system layout. The first reboot was not timed, but 2nd and 3rd reboot were averaged for the results here.
| System Boot Time (see definition above) MacBook Pro unibody 2.8GHz (late 2008), 6GB memory |
|
|---|---|
| Drive | Time (seconds) |
| Intel X25-M | 24.0 |
| Hitachi TravelStar 7K320 | 29.8 |
| Western Digital Scorpio Black | 28.0 |
| Western Digital Scorpio Blue | 30.2 |
| Seagate Momentus 7200.3 | 33.7 |
Hurrah, if you reboot once a day, you save 4-10 seconds, depending on the hard drive. But if the boot took zero time, it still would be irrelevant.
As the drive fills up, boot time will still be fast; system files aren’t going to self-fragment all over the disk willy-nilly. Partitioning can guarantee low seek times and fast performance, so simply use half or less of a 320GB or 500GB disk. Add 5 seconds if you’re worried about this issue—still irrelevant.
Ultra-high performance across entire capacity, outperforms the competition.
Tiny, bus-powered, rugged, compact!
Application launch speed PERMALINK
Applications launch very quickly with the Intel X-25M, but slightly slower than the speed you’ll see after you launch/quit/relaunch on a system with adequate system memory. Get adequate memory and forget about it: Mac OS X will cache the application, and you won’t have to quit it in the first place: leaving it running is infinitely faster than quitting and re-launching.
But if you love seeing your application launch in 3 seconds instead of 8 seconds (the first time), then SSD is your prescription for happiness. The machine will feel very quick with the Intel X25-M, for short bursts at least. You can even titillate yourself by rebooting over and over, watching how fast the machine boots and how fast applications launch the first time. Yay.
Below are some figures to contemplate. Times are wall clock time, with “+” meaning slightly more, "<" meaning “less than” and “~” meaning “about”. We’re not worried about tenths of a second here, just the general idea. The “Mac OS X Cached” line indicates a subsequent launch of the application, when it has been cached in memory by Mac OS X—it doesn’t get any faster than that.
The slowest application to launch here is Adobe DreamWeaver CS4, where the X25-M cut the time down from ~12 seconds to ~4, compared with ~3 for Mac OS X caching. In short, read access is incredibly fast, only a little slower than straight out of memory!
| Application launch time MacBook Pro unibody 2.8GHz (late 2008), 6GB memory Seconds, lower is faster |
|||||
|---|---|---|---|---|---|
| Drive | Photoshop CS4 | DreamWeaver CS4 | Capture NX2 | XCode | Safari |
| Intel X25-M | ~3 | ~4 | < 2 | ~2 | < 1 |
| Hitachi TravelStar 7K320 | 8+ | 12 | ~3 | ~5 | ~2 |
| Mac OS X 10.5.6 Cached | 2+ | 3 | < 1 | 1+ | < 1 |
Now let’s confront reality: savings a few seconds on application launch is meaningless over the course of the day. I might launch DreamWeaver CS4 and work in it for many hours. The 8 seconds I save on the first launch is just not relevant; what counts is how efficiently you can work in your applications, and if the X25-M improves in that area, then fast application launch times are a nice bonus.
Performance comparisons PERMALINK
A combination of DiskTester benchmark tests and real-world challenges were used to establish the merits of SSD versus hard disks. Real-world tasks should be given top priority as far as evaluating performance; benchmarks are useful but do not necessarily reflect real-world performance for specific tasks—and that is what really matters: do the tasks you perform actually benefit from an SSD.
Volume size
The Intel X25-M formats to 74.4GB.
For an objective comparison, all hard drive figures shown here are based on partitioning hard drives into a boot volume of 74.4GB, with the remainder of the hard drive unused bonus space. The resulting volume spans the fastest part of the drive, with much improved seek time characteristics also More. Apple’s was use for the partitioning.
Booted from the test drive
Except for the DiskTester create-files and read-files tests, the other tests detailed below were performed when booted off the 74.4GB volume: about 25GB of the 74.4G volume was in use. In other words, the results reflects what using an actual working system would be like, not an artificial setup with an empty disk.
File create/read/copy/process test PERMALINK
This test uses DiskTester’s create-files and read-files commands. These commands bypass the Mac OS X unified buffer cache, so they represent actual drive performance without the benefit of system caching, which closes the performance gap considerably in real-world use on systems with adequate memory. Also shown are a Finder copy (equal reads and writes), and computation overlapping with disk I/O (SHA1 hash).
The Intel X25-M offers stellar performance for reads: not the vastly superior performance for reading files and the SHA1 hash (also reading files). When write performance joins the mix, it dilutes the performance advantage.
Among the hard drives, the Seagate Momentus 7200.3 turns in a very impressive performance, trouncing its competitors on every test. This is quite a surprise, but the results are so consistent across the tests that its clear the Momentus is well-tuned to workloads that involve sustained read/write activity. This must be due to its significantly higher transfer speed.
| File create/read/copy/process test MacBook Pro unibody 2.8GHz (late 2008), 6GB memory Times in seconds, lower is faster |
||||
|---|---|---|---|---|
| Drive | Finder-copy 128 CR2 files (3.1GB) |
create / read 5120 1MB files (5GB) |
create / read 512 10MB files (5GB) |
IntegrityChecker SHA1 hash on 128 CR2 files (3.1GB) |
| Intel X25-M | 64 | 84.4 / 23.5 | 81.0 / 22.0 | 13.7 |
| Hitachi TravelStar 7K320 | 92 | 70.3 / 67.9 | 69.1 / 67.0 | 43.5 |
| Western Digital Scorpio Black | 86 | 67.5 / 64.0 | 67.8 / 64.1 | 41.0 |
| Western Digital Scorpio Blue | 91 | 66.2 / 67.0 | 66.2 / 66.0 | 42.7 |
| Seagate Momentus 7200.3 fastest hard drive |
79 | 59.2 / 59.0 | 59.1 / 59.0 | 37.8 |
Developer software build tests PERMALINK
Software developers might build in various ways with various technologies, but two common environments are represented here. See Optimizing Developer Builds.
The small size of source code files makes read speed a minimal concern, and with Mac OS X file caching it’s non-existent concern: I observed builds running for seconds at a time with no read I/O whatsoever, nullifying the speed advantage of SSD. This matches reality precisely: developers build repeatedly, and on Mac OS X, everything read sits in the cache for the next time it’s needed.
Write speed makes the most difference for builds, and here SSD offers an insignificant advantage. The XCode build used 200% CPU (the maximum on dual-core), indicating no bottlenecks whatsoever with disk I/O. The maven build is more sensitive to write speed, and here the Hitachi Travelstar eked out 1-second win over the X25-M!
| Developer software build tests MacBook Pro unibody 2.8GHz (late 2008), 6GB memory Times in seconds, lower is faster |
||
|---|---|---|
| Drive | XCode Build DiskTester |
Maven Build GlassFish V3 |
| Intel X25-M | 141 | 160 |
| Hitachi TravelStar 7K320 | 141 | 159 |
| Western Digital Scorpio Black | 141 | 164 |
| Western Digital Scorpio Blue | 143 | 166 |
| Seagate Momentus 7200.3 | 141 | 163 |
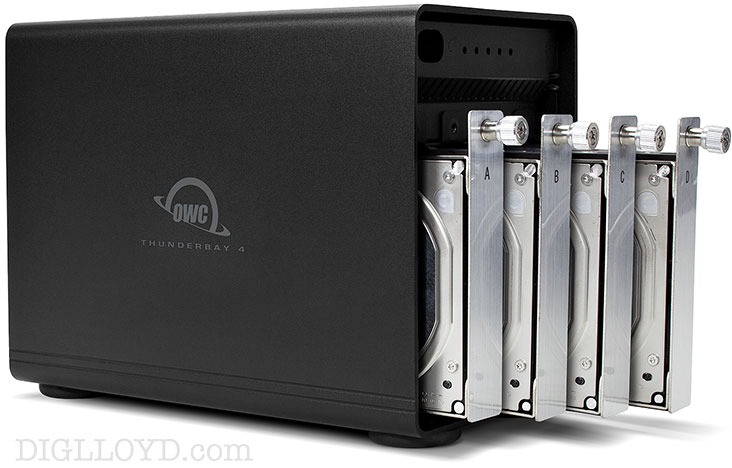
High capacity, high-performance fault-tolerant storage for photography and video.
Non-RAID or RAID-0/1/4/5/10.
Capacities up to 72 Terabytes!
Photoshop large file processing PERMALINK
This test used diglloydMedium, which generates a 15.7GB scratch file. See Optimizing Photoshop for details.
The Intel X25-M fared very well here, but it must be kept in mind that a 15.7GB scratch file represents 21% of the drive capacity (74.4GB), and that a worthwhile system will occupy at least 25GB, so it then represents 32% of the free space! That’s not much room to maneuver if you actually want to store useful work on your drive. A dual-drive striped eSATA RAID offers even better performance than the X25-M on this test (220 vs 241); see the MacBook Pro results.
Among the hard drives, the Seagate Momentus 7200.3 trounces its competitors, just as it did in the file copy tests. This must be due to its significantly higher transfer speed.
| Photoshop large file processing MacBook Pro unibody 2.8GHz (late 2008), 6GB memory Times in seconds, lower is faster |
|
|---|---|
| Drive | diglloydMedium |
| Intel X25-M | 241, 242 |
| Hitachi TravelStar 7K320 | 353, 357 |
| Western Digital Scorpio Black | 340, 346 |
| Western Digital Scorpio Blue | 424, 423 |
| Seagate Momentus 7200.3 fastest hard drive | 320, 325 |
Unix commands PERMALINK
Mac OS X is unix, and two commonly-used commands are find and grep. The Intel X25-M offers substantial speedups for these commands, but of course the Mac OS X cache neutralizes the advantage once files have been read into the cache the first time (so long as there is unused system memory).
The advantage is not as much as one might hope; the hard drive takes about 50% longer the first time, then subsequent invocations are the same (within the normal variation).
| Unix commands MacBook Pro unibody 2.8GHz (late 2008), 6GB memory Times in seconds, lower is faster |
||
|---|---|---|
| Drive | cd /; sudo find . -name foobar 123 | cd /work; grep -R foobar123 . |
| Intel X25-M | 16.72 |
16.664 2.160 |
| Hitachi TravelStar 7K320 | 24.64 |
24.901 2.165 |
DiskTester results PERMALINK
DiskTester bypasses the Mac OS X cache and the figures shown therefore represent actual drive performance independent of caching. The figures are a good starting place for understanding general performance.
DiskTester transfer size tests PERMALINK
The size of the data transfer (chunk) has a substantial influence on speed until sufficient size is reached. Many applications read and write data in chunks even smaller than 32K, but the Mac OS X caching scheme hides the dismal performance problems with that approach—another reason to always have enough memory.
The Intel X25-M shows disappointing write speed, slower even than the 5400 rpm Western Digital Scorpio Blue except for 32K chunks. Read performance of the X25-M is exceptional. Coupled with no seek time and essentially zero latency, it’s a snappy combination.
Among the hard drives, the Seagate Momentus 7200.3 shows a very impressive advantage in sustained transfer rate over its competitors.
| DiskTester sequential chunk size test MacBook Pro unibody 2.8GHz (late 2008), 6GB memory Figure are megabytes per second, higher is faster |
|
|---|---|
| Drive | disktester run-sequential-suite |
| Intel X25-M | Chunk Size Write MB/sec Read MB/sec 32K 52.7 105 64K 55.3 125 128K 58.7 169 256K 60.6 211 512K 62.3 228 1MB 63.5 230 2MB 64.2 238 4MB 64.4 244 8MB 64.3 247 16MB 65.0 249 32MB 64.3 250 |
| Hitachi TravelStar 7K320 | Chunk Size Write MB/sec Read MB/sec |
| Western Digital Scorpio Black | Chunk Size Write MB/sec Read MB/sec |
| Western Digital Scorpio Blue | Chunk Size Write MB/sec Read MB/sec |
| Seagate Momentus 7200.3 fastest hard drive | Chunk Size Write MB/sec Read MB/sec |
DiskTester random access PERMALINK
It is not useful to perform a random access across the entire drive. Files/data are not arranged or accessed that way in most real-life situations; related data is frequently clustered together on disk.
Therefore, a fixed 32GB test file size was used, a size corresponding to a system install, applications and a core set of data. Users filling their drive to 90% of capacity (or even 60%) will of course see greatly degraded performance, but fragmentation and seek time are not the primary issue Why.
To test random access speed, the following DiskTester command was used, performing 8192 random writes of 64K each, following by 8192 random reads of 64K each:
disktester run-random --iterations 3 --test-size 32G --chunk-size 64K volume_name
The Intel X25-M SSD is able to maintain a far higher level of performance for random access, very very impressive. This looks perfect for database applications, but will have only modest impact on normal use of a MacBook Pro (the MBP is not likely to be a database server for large databases!). Still, it shows that in a server environment, solid state offers compelling advantages.
Of particular interest is how multiple iterations show that the drives are all able to “soak up” the first pass, but that all show large declines in random write performance on the 2nd and 3rd iterations. In real world non-server usage, 8192 random writes or reads is probably sufficient to cover normal “bursts”.
| DiskTester random writes/read MacBook Pro unibody 2.8GHz (late 2008), 6GB memory Numbers are transactions (64K each), higher is faster |
|||
|---|---|---|---|
| Drive | Iteration 1 write/read |
Iteration 2 write/read |
Iteration 3 write/read |
| Intel X25-M | 793 / 1340 | 485 / 1242 | 477 / 1245 |
| Hitachi TravelStar 7K320 | 127 / 84 | 48 / 85 | 48 / 85 |
| Western Digital Scorpio Black | 159 / 95 | 62 / 95 | 62 / 95 |
| Western Digital Scorpio Blue | 159 / 86 | 58 / 87 | 59 / 87 |
| Seagate Momentus 7200.3 | 135 / 75 | 40 / 75 | 40 / 74 |
DiskTester area test results (sustained write speed) PERMALINK
The area test measures the performance across the volume capacity, which declines greatly with hard drives across their full capacity. However, results shown here all from a 74.4GB volume, to match volume size of the X25-M.
The following DiskTester command used was:
disktester run-area-test --iterations 3 --test-size 512M --chunk-size 1M volume_name
Note that all of the hard drives outperform the X25-M on sustained write performance. However, write performance that involves random access will likely favor the X25-M, since it has zero seek time and essentially zero latency.
Among the hard drives, the Seagate Momentus 7200.3 shows a very impressive advantage in sustained transfer rate over its competitors.
# Intel 80GB X25-M
----- Averages for "X25" (1GB/1MB, 3 iterations) -----
Area (73.0GB)    Write MB/sec    Read MB/sec
       0%            64.1            232
      10%            63.9            233
      20%            63.4            233
      30%            62.5            233
      40%            62.9            234
      50%            63.1            235
      60%            62.7            235
      70%            63.2            235
      80%            63.0            236
      90%            63.5            237
     100%            65.8            242
Average write speed across the volume: 63.5MB/sec
Average read speed across the volume: 235MB/sec

# Hitachi 320GB Travelstar 7K320
------ Averages for "ht320-80" (512MB/1MB, 3 iterations) -----
Area (73.2GB)    Write MB/sec    Read MB/sec
       0%            71.4            76.0
      10%            74.1            75.2
      20%            73.9            74.8
      30%            72.8            73.6
      40%            72.8            73.8
      50%            73.4            72.9
      60%            72.8            71.8
      70%            71.8            72.4
      80%            71.4            71.4
      90%            70.2            70.8
     100%            70.3            70.6
Average write speed across the volume: 72.3MB/sec
Average read speed across the volume: 73.0MB/sec
# Seagate 320GB Momentus 7200.3  <========= fastest hard drive
----- Averages for "sg320-80" (512MB/1MB, 3 iterations) -----
Area (73.2GB)    Write MB/sec    Read MB/sec
       0%            86.4            87.6
      10%            87.2            87.1
      20%            86.6            87.2
      30%            85.0            84.5
      40%            84.9            84.8
      50%            84.5            85.3
      60%            82.0            82.2
      70%            81.9            82.3
      80%            82.5            82.1
      90%            81.3            82.2
     100%            79.2            78.9
Average write speed across the volume: 83.8MB/sec
Average read speed across the volume: 84.0MB/sec

# Western Digital 320GB Scorpio Black
------ Averages for "wd320-80" (512MB/1MB, 3 iterations) -----
Area (73.2GB)    Write MB/sec    Read MB/sec
0%            76.6            79.3
10%            72.8            80.3
20%            75.5            79.8
30%            75.1            79.6
40%            75.3            78.9
50%            76.5            79.3
60%            75.5            78.3
70%            74.2            77.2
80%            73.9            77.1
90%            69.8            76.5
100%            68.1            75.3
Average write speed across the volume: 73.9MB/sec
Average read speed across the volume: 78.3MB/sec
# Western Digital 500GB Scorpio Blue
----- Averages for "wd500-80" (512MB/1MB, 3 iterations) -----
Area (73.2GB)    Write MB/sec    Read MB/sec
       0%            77.4            77.3
      10%            78.0            77.4
      20%            76.9            77.9
      30%            77.9            77.0
      40%            77.0            77.2
      50%            76.6            76.4
      60%            77.2            76.5
      70%            75.4            75.9
      80%            75.2            74.9
      90%            75.3            74.6
     100%            74.8            74.3
Average write speed across the volume: 76.5MB/sec
Average read speed across the volume: 76.3MB/sec
Controversy PERMALINK
A real problem? Yes, it is ove time.
SSD slowing down? Get it back into shape with DiskTester 'recondition' .
Conclusions and recommendations PERMALINK
Pricing and specifications: please use the View links at the top of this page.
Price is a rapidly-changing factor, and it will pollute an objective discussion of the merits of the X25-M, so we’ll leave price out of what follows.
If a formatted capacity of 74.4GB is adequate space for your needs, then the X25-M is a no-brainer—no internal laptop hard drive is going to offer higher performance.
Update: As of February 2009, Intel is shipping a 160GB model of the X25-M, with claimed identical performance. Formatted capacity should be around 149GB.
If you’re looking for a fast hard drive, the Seagate Momentus 7200.3 offers very impressive transfer speeds compared to its competitors, offering superior performance on various tests by 5-30%. Site sponsor OWC offers great deals on hard drives and memory.
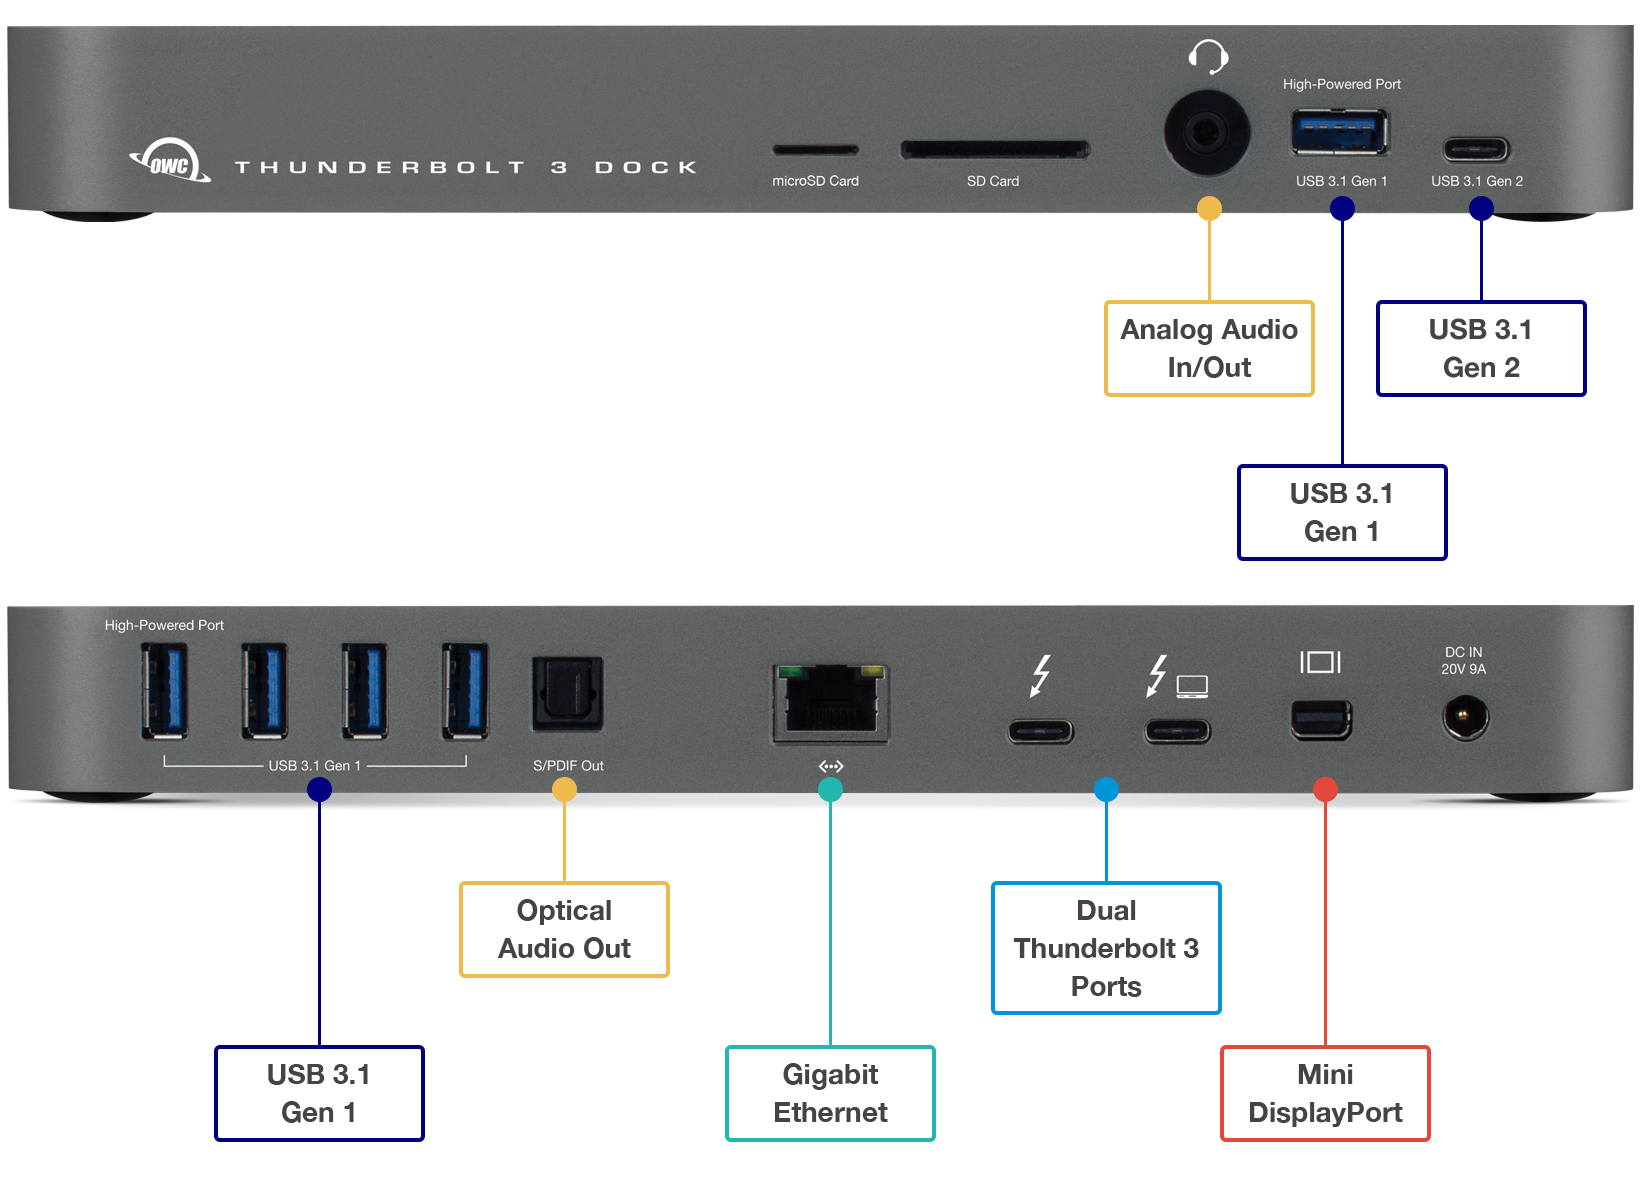
Ideal for any Mac with Thunderbolt 3
Dual Thunderbolt 3 ports
USB 3 • USB-C
Gigabit Ethernet
5K and 4K display support plus Mini Display Port
Analog sound in/out and Optical sound out
Works on any Mac with Thunderbolt 3
Huge potential
The Intel X25-M demonstrates the huge potential of solid state disks. There will be enormous industry pressure to take this technology mainstream; it’s the biggest leap in performance in quite some time.
In every test that involved reading significant amounts of data the X25-M is screaming fast, offering up to 3X the performance for applications limited by disk speed. Application launching is instantaneous (but no faster than a cached application). But remember that for most applications, drive performance doesn’t matter much once the application is running.
For tasks such as file copying, which involves equal writes and reads, the rather ordinary write speeds of the X25-M reduce what could be a 3X speed advantage down to about 50%—a very nice improvement. Yet if its write speed matched its read speed, the Finder copy test would take around 34 seconds, or half the time it currently takes. Of course, on a MacPro with striped RAID, such speeds are routine, but this is a laptop scenario!
Photoshop and large files
Photoshop users on the MacBook Pro working with large files where the scratch volume comes into play are going to love the X25-M (Mac Pro users are better off with a 3 or 4-drive striped RAID). Results with dual-drive eSATA on the MacBook Pro show that even the X25-M lags a bit; this is certainly due to its (relatively) slow write performance. After all, a scratch disk means data is being written.
While the X25-M does offer a performance surge to the editing of very large files in Photoshop, the limited capacity of the Intel X25-M makes it a catch-22: where will those large files be stored exactly? For that matter, if a 16GB scratch file is called for (eg the diglloydMedium test), will there even be space for the scratch file once the drive is used to store the large files being edited?
Some tasks do not benefit
For some tasks the benefits are minimal or even non-existent. For example, software developers can safely ignore SSD for making builds go faster; CPU speed, the number of CPU cores and write speed matter much more, at least on Mac OS X; the highly-effective Mac OS X caching masks the benefits of SSD.
It all depends
Whether the X25-M makes sense for any particular user/usage depends on the exact task(s). Potential buyers will need to understand whether their tasks are being slowed by hard drive access, and whether it’s read speed or write speed. This information can be learned by watching the Activity Monitor display.
Reference
More than you want to know perhaps, but interesting reading.
Tom’s hardware: Intel’s First Flash SSD Ready for Vertical Take-Off
Seagate 22TB IronWolf Pro 7200 rpm SATA III 3.5" Internal NAS HDD (CMR)
SAVE $100
