
 diglloydTools™


Viewing Processes and Memory in macOS Activity Monitor
Diagnosing system issues often begins with Activity Monitor (/Applications/Utilities).
By default, only the current user processes are shown (pretty much useless). To view all processes in Activity Monitor, choose . To see what processes are using CPU time, click on to sort so that the greatest usage is sorted at top (ditto for real memory and other useful metrics).
The two most useful metrics are %CPU and Real Mem along with Disk and Network statistics.
Below, real work is being done by 'java' (actually IntegrityChecker). That’s what you want to see when you want a job done fast—lots of CPU cores in use. But when something like accountsd just sits around and constantly chews up CPU cycles, that’s a useless major drag on system performance.
- Quit applications not in use, as many applications chew up enough CPU so that in total the system runs hotter and slower. For example, Dreamwaver and Photoshop will chew up 3% of a CPU each for hours on end.
- In general, dthere is little you can do about daemon processes, as in most cases they just get respawned if force-killed. You just have to live with bad design.
- Sorting by name can be helpful, but a vendor may use all sorts of names without the vendor name (very annoying), such as "Core Sync" and "CCX Process" from Adobe, so it’s hard to pin down all the crapware associated with any particular application.
- Clicking the Inspect ("i") icon at top will let you see open files and ports, revealing where the process lives.
- Drag the column dividers to change column width. You might need to do this—there is a forever bug in Catalina that can make the Process Name column as wide as the screen—scroll right and drag the darn thing to get it back to reasonable size.
- Control-click (right click) to add or remove columns.
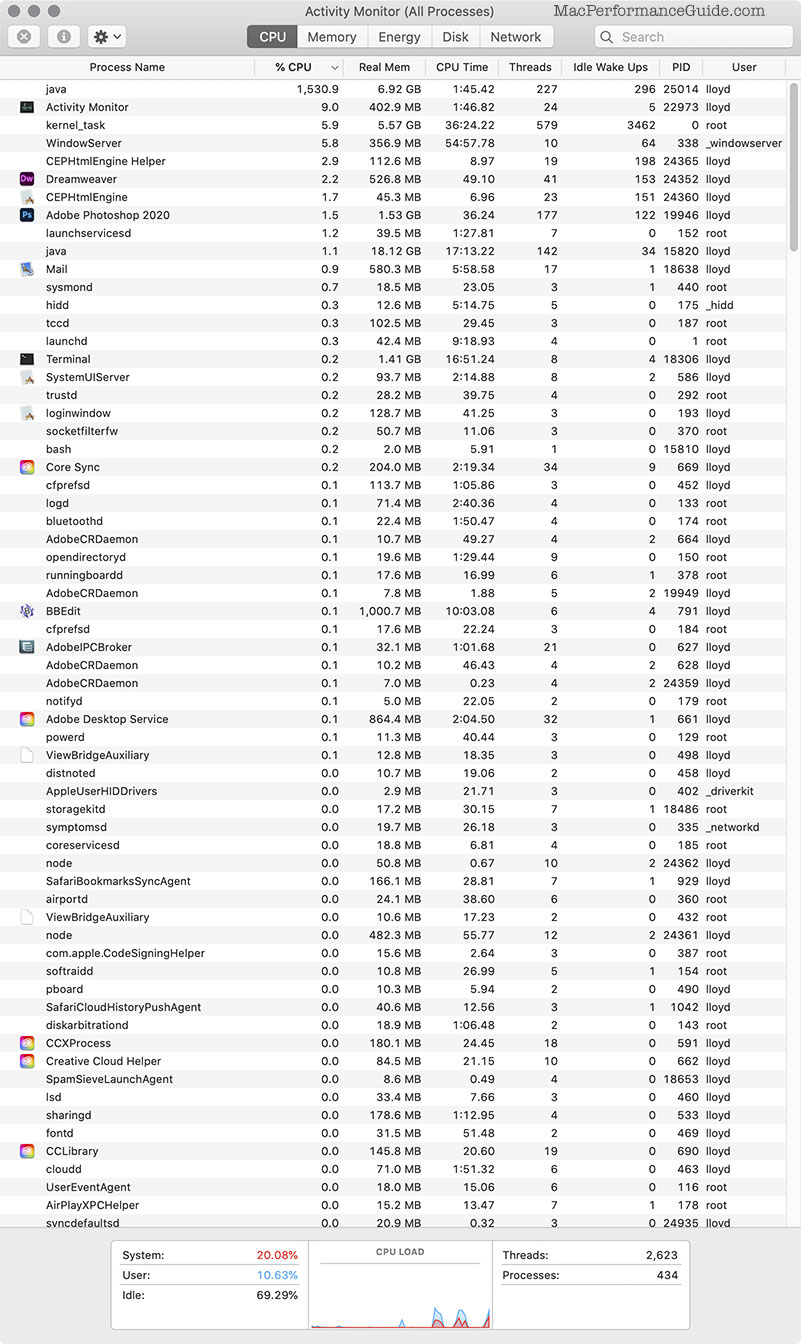
Activity Monitor showing %CPU, sorted by highest first
