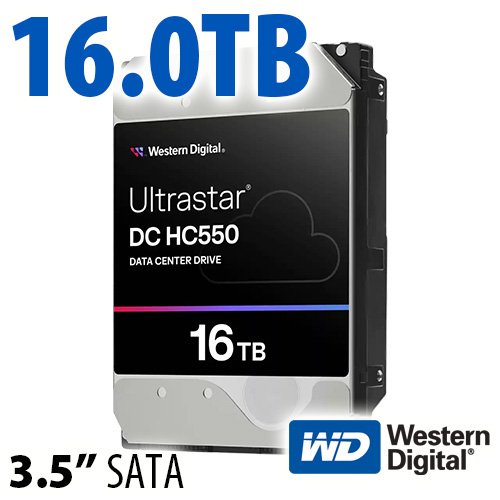
$220 SAVE $130 = 37.0% Western Digital 16.0TB Western Digital Ultrastar DC HC550 3.5-in… in Storage: Hard Drives
|
|

|
|

|

|

|

|

|

|
Mac Pro Nehalem Tests: Introduction
Multiple pages with test results follow, each discussing performance comparing the 2008 Mac Pro 2.8GHz (MP08) to the March 2009 Mac Pro “Nehalem”2.93GHz (MP09).
The MP09 enjoys a 4.6% clock speed advantage over the 2.8GHz MP08.
Estimates for the 3.2GHz 2008 Mac Pro
For purposes of actionable and useful comparisons, most graphs also include MP08-3.2 EST, an estimate for the running time with a 3.2GHz 2008 Mac Pro (based on the simple ratio of 2.8Ghz vs 3.2 GHz processor). Such estimates are deemed to be reasonably accurate enough to be used as the basis for making a decision, but specific tests could see variance from the expected value.
Estimates are provided only for tests where disk speed does not influence the results (most tests do not involved the disk in a significant way).
Comparison graphs
All comparison graphs show the fastest performance at the top and the slowest performance at the bottom, regardless of whether the figures represent time or rate.
The gray bar is always the MP08-3.2 EST estimated speed.
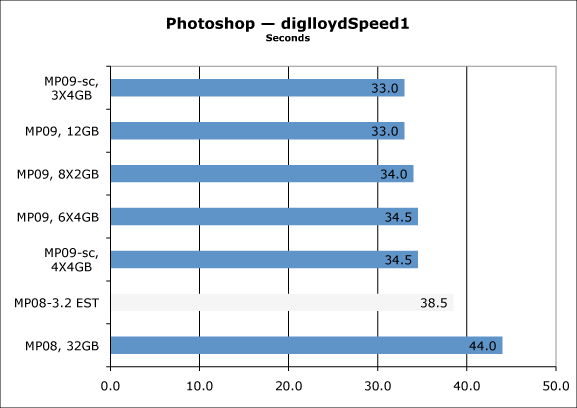
Configuration of the test machines PERMALINK
To keep the results as directly comparable as possible I configured both machines with the same system setup and applications, indeed Migration Assistant was used to match the new Mac Pro to my existing one.
System version
Mac OS X 10.5.6 was used for the tests here, unless otherwise indicated (future additions). All current patches applied at the date of testing. Both machines used identically configured systems (via cloning).
Boot drive
Both machines were booted from an Intel X25-M solid state drive. However, none of the tests involve the boot drive and it is not a relevant factor.
None of the tests are sensitive to boot drive speed; the internal striped RAID was used for files; it was measured at over 400MB/sec for reads and writes.
Hard drives (data)
Both machines used four (4) internal Western Digital RE-3 drives, both used a 4-way 128GB striped RAID partition for scratch/working space. Disk I/O speed was checked and found to be a non-issue with all tests except the diglloydMedium test, which demands high disk performance for the large scratch file it generates.
Memory
Tests indicate the amount of memory and number of modules.
Test results PERMALINK
Tests were repeated to verify consistency, with appropriate reboot and/or quiescent periods before starting In the more interesting/surprising cases, more trials were made to rule out any possibility of error.
Other tests PERMALINK
Rob-Art at BareFeats.com has some tests with Motion and Imaginator that show the relative video card speeds with video cards like the GeForce 120 GT (standard in the MP09), the Radeon HD 4870 (optional upgrade), and others. Rob also has some pro apps benchmarks and core image benchmarks.
Rob’s numbers are valuable in showing potential speed, but remember that benchmarks are “best case” and that actual performance differences between video cards might or might not materialize for any particular task or application.
Seagate 22TB IronWolf Pro 7200 rpm SATA III 3.5" Internal NAS HDD (CMR)
SAVE $100


 diglloydTools™